Quick Facts
- Standard Fasting: Under 100 mg/dL for non-diabetic adults.
- Diabetic Fasting Goal: 70 to 130 mg/dL for most non-pregnant adults.
- Post-Meal Target: Below 140 mg/dL (Normal) or less than 180 mg/dL (Diabetic).
- A1c Benchmark: A target of less than 7.0% to prevent long-term complications.
- Time in Range: Aim for >70% of daily readings between 70-180 mg/dL.
- Age Sensitivity: Targets may be relaxed for seniors over 60 to avoid hypoglycemia.
A normal blood sugar chart typically defines healthy fasting levels as under 100 mg/dL and post-meal readings below 140 mg/dL for non-diabetic adults. For individuals with diabetes, diabetes glucose range goals are often personalized but generally aim for fasting levels between 70-130 mg/dL and postprandial levels below 180 mg/dL to maintain optimal glycemic control.
Understanding the Universal Blood Sugar Chart
Navigating life with diabetes requires more than just willpower; it requires data. A blood sugar chart serves as a primary roadmap for anyone managing type 1 or type 2 diabetes, providing the benchmarks needed to interpret daily fluctuations. While clinical guidelines often focus on the prevention of immediate complications, modern nutrition science suggests that moving toward optimal glycemic control can significantly improve longevity and energy levels.
When we discuss glucose monitoring, we look at two main windows: preprandial readings (taken before a meal or while fasting) and postprandial glucose targets for adults (taken one to two hours after eating). For someone without diabetes, the body tightly regulates these numbers. However, insulin resistance or lack of insulin production makes it harder to stay within these narrow windows. According to the American Diabetes Association, a fasting blood sugar target of 80 to 130 mg/dL is recommended for most non-pregnant adults with diabetes.
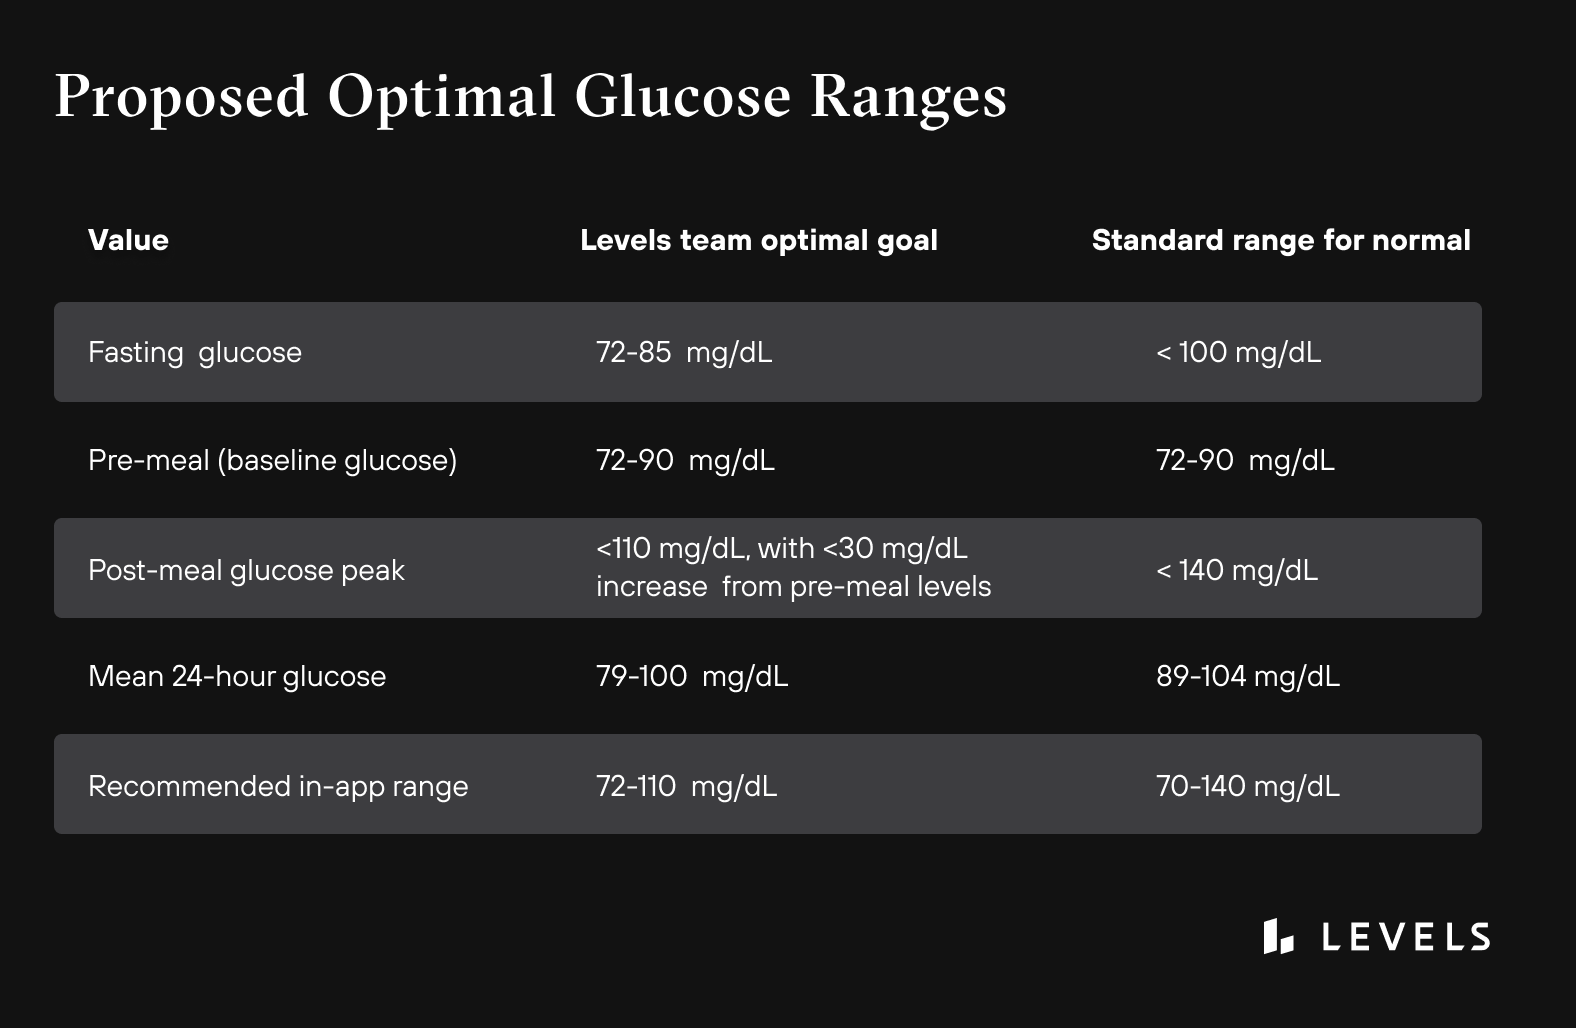
Understanding the difference between clinical "Normal" and "Optimal" health is crucial. While a fasting blood sugar of 99 mg/dL is clinically normal, many metabolic health experts believe that maintaining a fasting blood sugar range for type 2 diabetes prevention—ideally between 72-85 mg/dL—offers superior protection against cardiovascular strain. If your numbers consistently trend toward hyperglycemia, it may indicate a need for adjustments in meal timing or carbohydrate composition. Conversely, preventing hypoglycemia (readings below 70 mg/dL) is the highest priority for immediate safety.
Table 1: Universal Blood Sugar Chart (ADA 2026 Standards)
| Status | Fasting (Pre-meal) | Post-meal (1-2 Hours) | A1c Level |
|---|---|---|---|
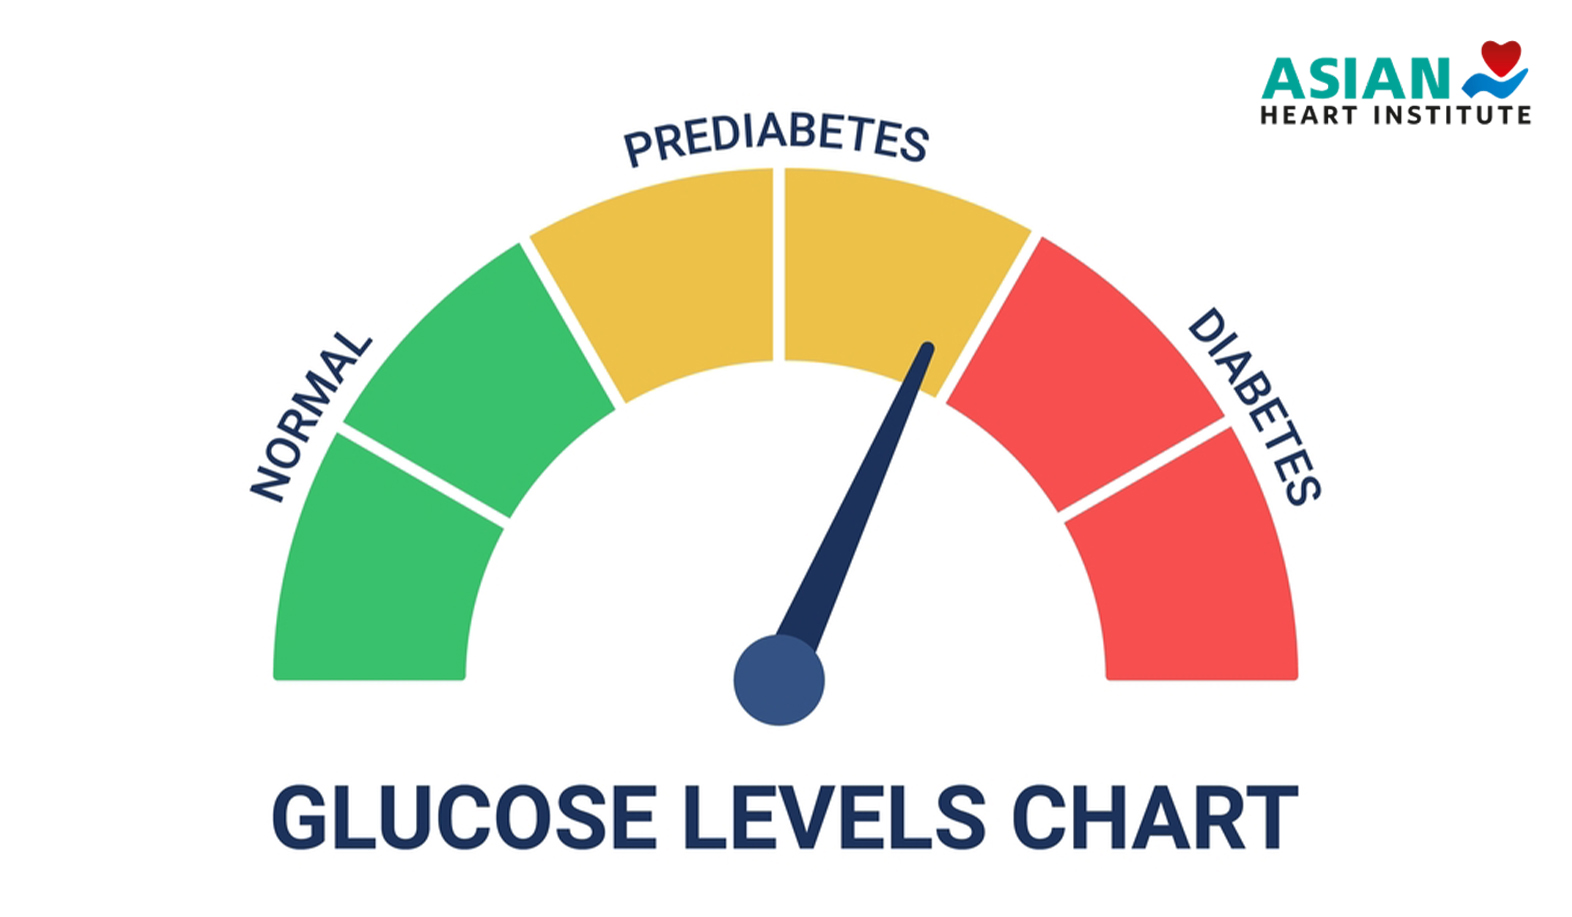
| Normal (Non-Diabetic) | 70–99 mg/dL | <140 mg/dL | <5.7% |
| Prediabetes | 100–125 mg/dL | 140–199 mg/dL | 5.7%–6.4% |
| Diabetes | 80–130 mg/dL | <180 mg/dL | <7.0% |
Normal Blood Sugar Levels by Age
As we age, our metabolic needs and biological responses change. Hormonal shifts, changes in muscle mass, and evolving insulin sensitivity mean that a one-size-fits-all blood sugar chart is often insufficient. For example, children have higher metabolic rates and often experience more significant glucose swings due to growth hormones and unpredictable activity levels.
In the adult years, the focus remains on preventing chronic damage to the kidneys, eyes, and nerves. For many adults with diabetes, the standard post-meal blood sugar target is less than 180 mg/dL when measured one to two hours after the start of a meal. However, once a patient moves into the senior category, the strategy often shifts.
For normal blood sugar levels for seniors over 60, doctors may relax targets slightly. This is because the risk of a fall or cognitive impairment caused by low blood sugar often outweighs the benefits of ultra-tight glucose control. Seniors may have acceptable fasting targets up to 110-120 mg/dL to provide a safety buffer. Understanding these normal blood sugar levels by age helps patients and caregivers set realistic goals that prioritize quality of life alongside clinical safety.
Table 2: Age-Stratified Glucose Goals
| Age Group | Fasting Range | Post-meal Range | Bedtime Range |
|---|---|---|---|
| Children (<6 years) | 80–100 mg/dL | ~150 mg/dL | 110–200 mg/dL |
| Children (6-12 years) | 80–100 mg/dL | <140 mg/dL | 100–180 mg/dL |
| Teens (13-19 years) | 70–100 mg/dL | <140 mg/dL | 90–150 mg/dL |
| Adults (20-59 years) | 70–99 mg/dL | <140 mg/dL | <120 mg/dL |
| Seniors (60+ years) | 70–110 mg/dL | <150 mg/dL | 100–140 mg/dL |
Modern Metrics: Interpreting Glucose Monitor Readings
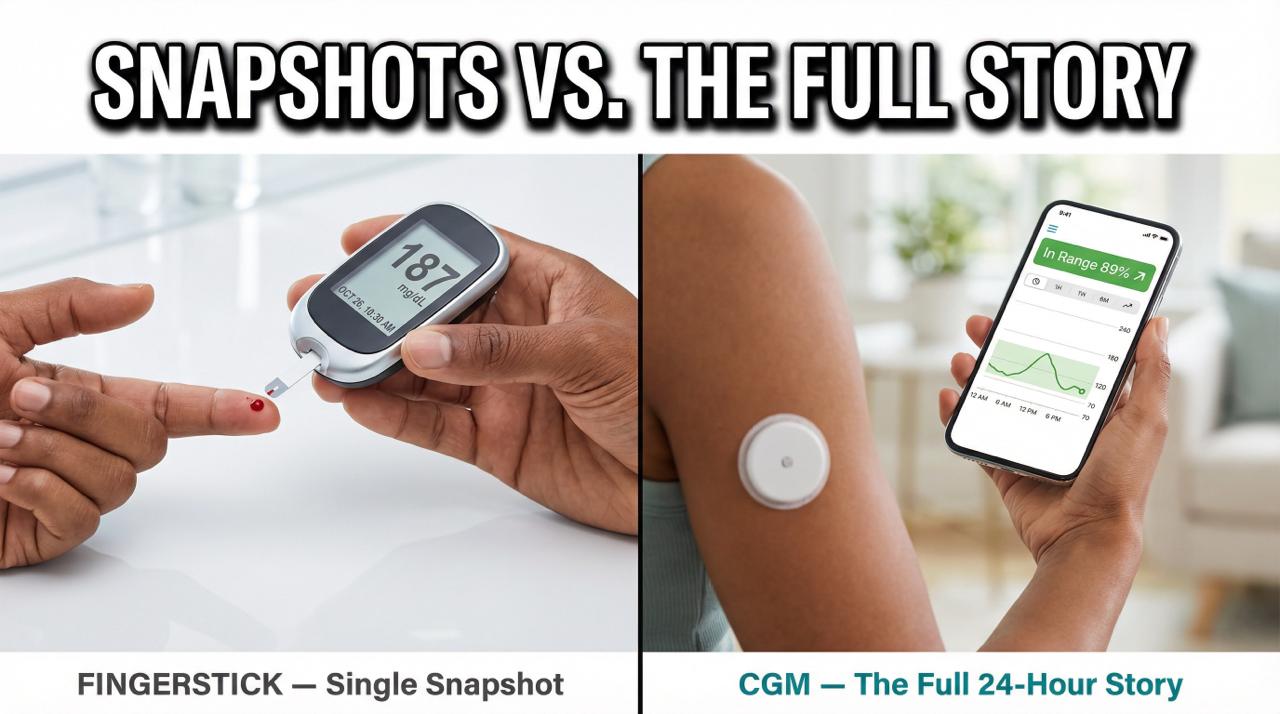
Traditionally, diabetes management relied on "fingerstick" tests that provided a single snapshot in time. While useful, these snapshots don't tell the whole story of how your body handles a bowl of oatmeal or a stressful work meeting. The advent of the Continuous Glucose Monitor (CGM) has revolutionized our ability in interpreting glucose monitor readings by providing a constant stream of data.
When interpreting continuous glucose monitor trends, we look for patterns rather than isolated numbers. Are your levels rising steadily throughout the afternoon? Do you see sharp glucose spikes immediately after exercise? These trends are more actionable than a single daily logbook entry. One of the most critical metrics today is Time in Range (TIR). This represents the percentage of time your glucose stays within your target window, typically 70 to 180 mg/dL.
The American Diabetes Association suggests a target A1C level of less than 7.0% for most non-pregnant adults with diabetes. While A1c measures a three-month average, time in range targets for diabetic health provide a day-to-day view of glycemic variability. Minimizing this variability—the "rollercoaster" effect—is key to feeling better and reducing long-term inflammation.
Table 3: A1c to Average Glucose Conversion
| A1c Percentage (%) | Estimated Average Glucose (mg/dL) | Estimated Average Glucose (mmol/L) |
|---|---|---|
| 6.0% | 126 mg/dL | 7.0 mmol/L |
| 6.5% | 140 mg/dL | 7.8 mmol/L |
| 7.0% | 154 mg/dL | 8.6 mmol/L |
| 7.5% | 169 mg/dL | 9.4 mmol/L |
| 8.0% | 183 mg/dL | 10.2 mmol/L |
Common Outliers: The Dawn Effect & Mimics
If you have ever woken up with a high reading despite not eating since the previous evening, you have likely encountered the dawn effect. This phenomenon occurs when the body releases hormones like cortisol and growth hormone in the early morning hours (usually between 4:00 a.m. and 8:00 a.m.) to prepare you for the day. These hormones trigger the liver to release stored glucose, causing a spike in your blood sugar chart.
Understanding the dawn effect in blood sugar charts is essential for preventing unnecessary frustration. For most, this spike is around 7-10 mg/dL, but for those with significant insulin resistance, it can be much higher. To differentiate the dawn effect from other issues, it is helpful to check bedtime glucose levels. If your blood sugar is normal at bedtime but high in the morning, the dawn effect is the likely culprit. If it is high at both times, your evening meal composition or medication dosage may need review.
Other factors can also mimic hyperglycemia. Dehydration, for instance, concentrates the sugar in your bloodstream, leading to higher mg/dL units on your monitor even if your metabolic health is stable. Stress and lack of sleep can also trigger cortisol-related spikes that are unrelated to food intake.
FAQ
What is a normal blood sugar range for adults?
For a healthy adult without diabetes, a normal range is generally considered 70 to 99 mg/dL when fasting and less than 140 mg/dL two hours after a meal. Maintaining levels within these bounds is a hallmark of good metabolic health and effective glycemic control.
What should my blood sugar be 2 hours after eating?
For non-diabetics, the target is typically under 140 mg/dL. For individuals with diabetes, the ADA recommends a post-meal goal of less than 180 mg/dL. Consistently staying below these thresholds helps prevent damage to the cardiovascular system and small blood vessels.
What is a dangerously high blood sugar level?
Blood sugar levels above 240 mg/dL are generally considered dangerously high and may require immediate medical attention or a check for ketones, especially in type 1 diabetes. Chronic readings above 200 mg/dL are associated with long-term health complications and indicate a need for a treatment plan adjustment.
How do blood sugar levels change with age?
As we age, our bodies may become less efficient at processing glucose, often due to a natural increase in insulin resistance and a decrease in muscle mass. Consequently, blood sugar targets for seniors over 60 are often slightly higher (110-120 mg/dL fasting) to reduce the risk of dangerous hypoglycemic episodes.
What are the symptoms of low blood sugar?
Low blood sugar, or hypoglycemia, typically occurs when levels drop below 70 mg/dL. Common symptoms include shakiness, sweating, rapid heartbeat, dizziness, confusion, and extreme hunger. It is vital to treat these symptoms immediately with a fast-acting carbohydrate like fruit juice or glucose tablets.
Next Steps for Metabolic Health
Data is only as powerful as the actions it inspires. Keeping a detailed glucose logbook is one of the most effective ways to bridge the gap between clinical charts and your personal health journey. By recording what you eat, your activity levels, and your stress alongside your blood sugar readings, you can begin to see the "why" behind the numbers.
While the charts provided here offer a standard framework, they are not a substitute for professional medical advice. Always consult your healthcare provider before making significant changes to your diet or medication based on your blood sugar chart. Your doctor can help you establish personalized goals that account for your unique medical history and lifestyle.

Managing diabetes is a marathon, not a sprint. By focusing on consistent glycemic control, utilizing modern monitoring tools, and understanding how age and time of day affect your numbers, you can take charge of your health and live a vibrant, active life.