Quick Facts
- Clinical Purpose: The A1C test measures your average blood sugar levels over the past two to three months by analyzing glycated hemoglobin.
- Normal Range: A result below 5.7% is considered normal for most adults.
- Prediabetes Range: Results between 5.7% and 6.4% indicate prediabetes.
- Diabetes Diagnosis: A level of 6.5% or higher signals diabetes.
- Test Window: This metric provides a long-term perspective on metabolic health by reflecting the last 90 days of glucose exposure.
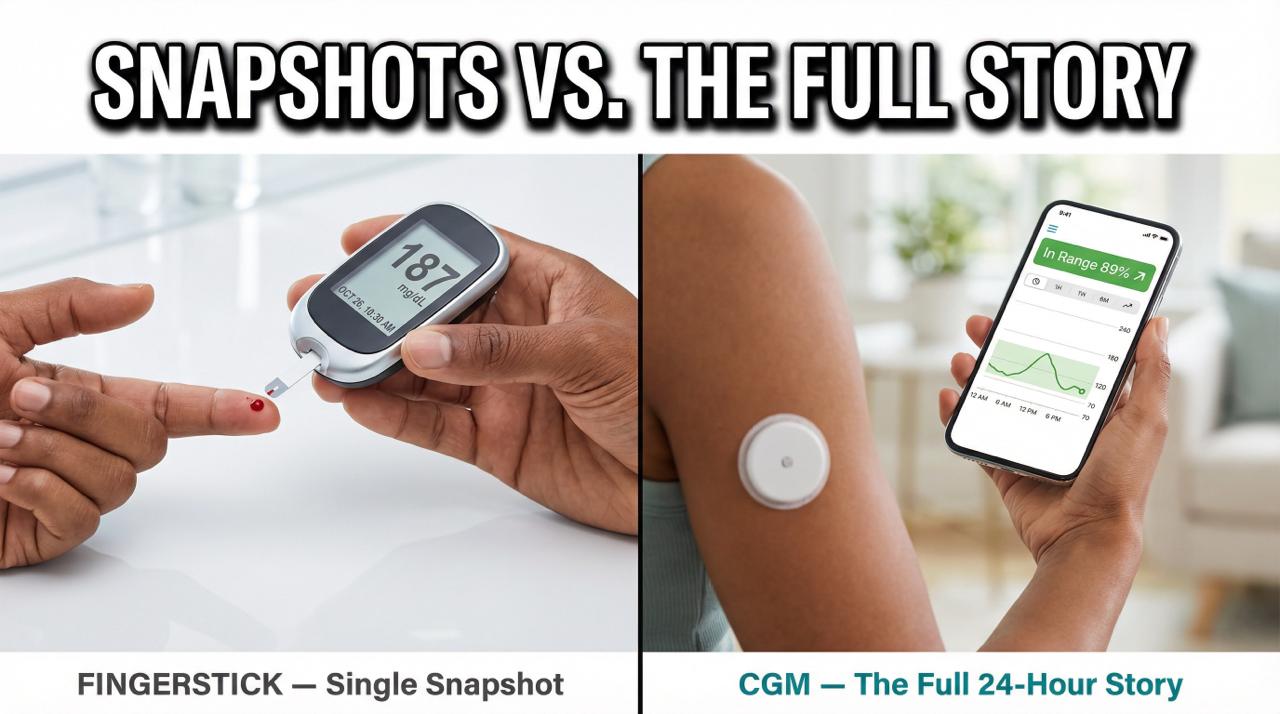
- Key Benefit: Unlike daily finger-pricks, it offers a stable average blood glucose measurement that isn't affected by a single meal or stressful morning.
- Therapeutic Target: For those living with diabetes, the American Diabetes Association (ADA) generally recommends an A1C target of 7% or less to reduce long-term complications.
The A1C test measures your average blood sugar levels over the past two to three months by analyzing glycated hemoglobin. For most adults, a result below 5.7% is considered normal, while levels between 5.7% and 6.4% indicate prediabetes, and 6.5% or higher suggests diabetes. It provides a long-term perspective on metabolic health that individual fasting glucose tests or daily finger-pricks cannot capture.
What is the A1C Test? Understanding the 3-Month Average
When we talk about managing our health, we often focus on the here and now—what we ate for breakfast or how we feel after a workout. However, metabolic health is a marathon, not a sprint. The A1C test serves as a vital bridge between our daily choices and our long-term wellness. Instead of capturing a single moment in time, this test looks at the big picture of how your body handles sugar over approximately 90 days.
At its core, the test measures glycated hemoglobin. Hemoglobin is the protein in your red blood cells that carries oxygen. When glucose enters your bloodstream, some of it naturally sticks to these hemoglobin molecules. The more sugar in your blood, the more "sugar-coated" your hemoglobin becomes. Because red blood cells have a typical lifespan of about three months, checking the percentage of glycated hemoglobin provides a reliable average blood glucose measurement for that period.
Understanding this biological mechanism helps explain why your A1C result is so stable. While a high-carb dinner might spike your blood sugar for a few hours, it is only a small fraction of the 90-day window. This makes the A1C test an essential tool for chronic disease management, as it filters out the noise of daily glycemic variability to reveal your true metabolic baseline.
Interpreting A1C Results: Normal, Prediabetes, and Diabetes
Interpreting A1C results is the first step toward taking control of your preventive care. The results are presented as a percentage, representing the portion of your hemoglobin that is saturated with sugar. According to the Centers for Disease Control and Prevention (CDC), these percentages fall into three distinct categories that help clinicians assess your risk for metabolic complications.
| A1C Level | Health Category |
|---|---|
| Below 5.7% | Normal |
| 5.7% to 6.4% | Prediabetes |
| 6.5% or higher | Diabetes |
If your result falls in the normal A1C range, it suggests that your body is effectively regulating glucose. However, if you find yourself in the 5.7% to 6.4% range, this is a signal of prediabetes. This isn't a "failure," but rather a valuable early warning system. At this stage, your insulin sensitivity may be decreasing, but lifestyle changes can often reverse the trend before it progresses.
For those whose results are 6.5% or higher, a diabetes diagnosis is usually confirmed with a repeat test on a different day. How often to repeat A1C testing for diabetes depends on your specific health goals and treatment plan. Most healthcare providers recommend testing every three to six months to monitor how well your management strategies are working.
The eAG Conversion: A1C vs. Estimated Average Glucose
While the A1C percentage is the clinical standard, many people find it easier to relate to the numbers they see on their home glucose monitors. This is where the concept of estimated average glucose (eAG) comes in. The eAG translates your A1C percentage into the mg/dL units used in daily monitoring.
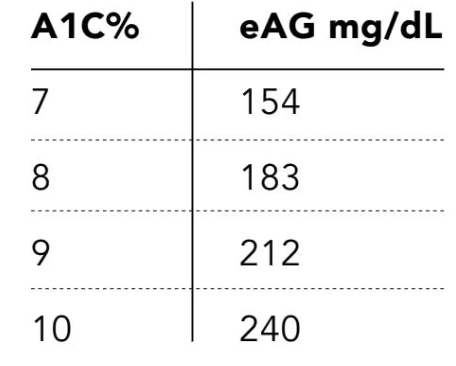
For instance, an A1C result of 7% translates to an eAG of approximately 154 mg/dL, reflecting your average blood sugar level over the preceding 90 days. This conversion helps bridge the gap between a lab report and your daily lived experience.
| A1C Percentage (%) | Estimated Average Glucose (mg/dL) |
|---|---|
| 5 | 97 |
| 5.5 | 111 |
| 6 | 126 |
| 6.5 | 140 |
| 7 | 154 |
| 7.5 | 169 |
| 8 | 183 |
Understanding a1c vs estimated average glucose is particularly helpful if you notice discrepancies between your morning finger-pricks and your lab results. A low fasting glucose result might hide high spikes after meals. The eAG captures those spikes, providing a more comprehensive view of your time-in-range and overall glycemic control.
Clinical Normal vs. Optimal Metabolic Health
As a preventive care editor, I often encourage readers to look beyond the "pass/fail" nature of lab results. While a result of 5.6% is technically within the normal A1C range, it is on the very edge of prediabetes. In the world of holistic wellness, we often distinguish between being clinically normal and having optimal metabolic health.
Optimal insulin sensitivity usually correlates with an A1C level in the lower end of the normal range, typically between 4.8% and 5.2%. Research suggests that as A1C moves toward the higher end of the "normal" bracket, the risk for future metabolic dysfunction begins to climb. By catching these trends early, we can implement preventive screening and lifestyle shifts while the body is still highly resilient.
Focusing on optimal health means prioritizing the long-term protection of your vascular system and organs. High-normal sugar levels over decades can still contribute to subtle inflammation, making it worthwhile to monitor your A1C test results even if you haven't been diagnosed with a condition.
When the Test Might Be Wrong: Factors Affecting Accuracy
While the A1C test is a gold standard, it is not infallible. Because the test relies on the typical 90-day lifespan of red blood cells, any condition that shortens or lengthens their survival will distort the results. If your red blood cells don't live as long as they should, the glucose has less time to "stick," leading to a falsely low reading. Conversely, if they live longer, the reading may be falsely high.
There are several common factors that can lead to inaccurate A1C results:
- Iron deficiency anemia: This can sometimes lead to falsely elevated A1C levels because it affects the age of the red blood cell population.
- Kidney disease: Chronic kidney issues can alter red blood cell turnover and lead to variations in how hemoglobin is glycated.
- Hemoglobin variants: Certain genetic variations in hemoglobin, more common in people of African, Mediterranean, or Southeast Asian descent, can interfere with standard lab measurements.
- Recent blood loss or transfusion: Anything that causes a rapid change in your red blood cell count will make the 3-month average inaccurate for a period of time.
If you feel your A1C result doesn't match your lifestyle or your daily monitoring, it’s worth discussing these nuances with your doctor. In such cases, alternative tools like a fructosamine test or continuous glucose monitoring may provide a clearer picture.
Preparation and Next Steps: How to Lower Your A1C
One of the most frequent questions I receive is how to prepare for an a1c test. The good news is that unlike a fasting glucose test, you do not need to fast. You can eat and drink normally before the blood draw, as the test is looking at the last few months, not the last few hours. This convenience makes it one of the easiest markers to track during a routine check-up.
If your results are higher than you’d like, remember that metabolic health is dynamic. There are many practical lifestyle changes to lower a1c levels that can have a profound impact within just one or two test cycles.
- Prioritize Movement: Aim for at least 150 minutes of moderate-intensity exercise per week. Physical activity helps your muscles use glucose for energy more efficiently, which directly improves insulin sensitivity.
- Focus on Fiber: Fiber slows the absorption of sugar into your bloodstream. Swapping refined grains for whole foods like lentils, leafy greens, and berries can significantly reduce post-meal glucose spikes.
- Sleep Quality: Poor sleep can trigger cortisol, which in turn raises blood sugar. Aiming for 7-9 hours of restful sleep is a pillar of chronic disease management that is often overlooked.
- Consistency in Monitoring: If you are in the prediabetes range, interpreting a1c results for prediabetes every six months can help you stay motivated as you watch your numbers improve.

Empowering yourself with knowledge about your average blood glucose measurement is the first step toward a longer, healthier life. By focusing on sustainable daily routines and preventive screening, you can move toward your optimal wellness goals.

FAQ
What does an A1C test measure?
The test measures the percentage of your hemoglobin that is glycated, or coated in sugar. This percentage reflects your average blood glucose levels over the past two to three months, which is the typical lifespan of a red blood cell.
What is a normal A1C level for a non-diabetic?
For most healthy adults without diabetes, a normal A1C level is below 5.7%. Results between 5.7% and 6.4% are categorized as prediabetes, indicating a higher risk for developing diabetes in the future.
Do you need to fast before an A1C test?
No, fasting is not required for an A1C test. Because the test measures a long-term average rather than your current blood sugar, what you eat immediately before the blood draw will not affect the results.
How often should you have an A1C test?
If your results are normal, once a year is often sufficient. However, if you have prediabetes, your doctor may suggest testing every six months. For those managing diabetes, testing every three months is standard to ensure therapeutic targets are being met.
What factors can cause a false A1C result?
Conditions that affect red blood cell turnover, such as iron deficiency anemia, sickle cell trait, kidney disease, or recent blood loss, can lead to inaccurate results. Certain medications and vitamins may also influence the reading.
How long does it take to lower your A1C?
Since the test measures a three-month average, it typically takes about 90 days to see the full impact of lifestyle changes on your A1C score. However, small improvements can often be seen in as little as two to four weeks through consistent diet and exercise adjustments.